Hyperliquid Slippage: What a Market Order Costs by Market and Size
Measured slippage on Hyperliquid for $1,000 to $1 million market orders on BTC, ETH, HYPE and HIP-3 markets, plus how to estimate it for your own order.
Slippage is the gap between the price you see and the average price you get. The price you see is the mid price, the midpoint between the best bid and the best offer. A market order doesn't fill at one price. It takes the best offer in the order book, then the next best, and keeps going until it's full, so the bigger the order, the worse the average.
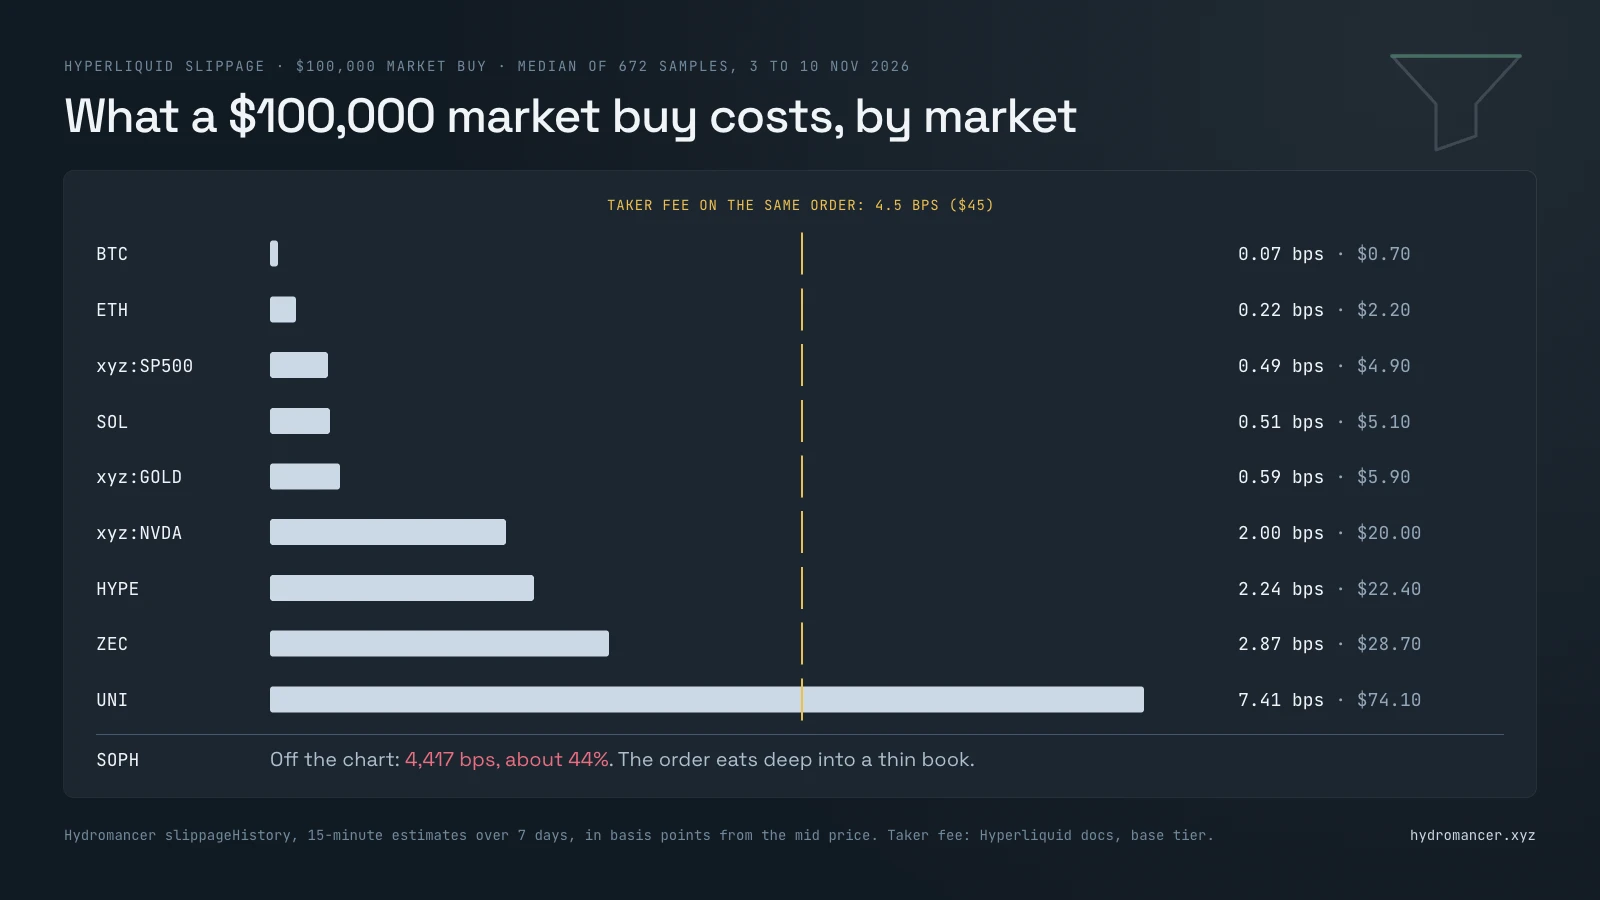
On Hyperliquid that gap runs from almost nothing to a large part of your order, depending on the market. Over the week we measured, a $100,000 market buy of BTC typically slipped 0.07 basis points, which is 70 cents. (A basis point is 0.01%, so on $100,000 one basis point is $10.) The same order on UNI slipped 7.4 basis points, $74. On SOPH, a small market, it slipped 44%.
Hyperliquid slippage isn't one number. It's a number per market, per order size and per moment.
Every number in this article comes from tests we ran on 10 November 2026. The method and the full results are in Test and Validation near the end.
Which numbers your app needs
It depends on when you're asking. If a trader is about to press the button, you want the cost of that order right now, and Hyperliquid's own order book gives you that for free. If you're building something that plans ahead, such as an execution tool choosing a slice size, a bot deciding which markets are worth trading, or a backtest that should charge realistic costs, then right now isn't enough. You need to know what that order size has cost over days and weeks, including the bad moments. Hyperliquid's API doesn't keep that, and it's where Hydromancer's history comes in.
What a market order is on Hyperliquid
Through the API, there's no separate market order. A market order is a limit order marked immediate-or-cancel (IOC), priced far enough through the book that it fills at once. Whatever doesn't fill at that price or better is canceled.
That price is your slippage tolerance, the worst price you'll accept. It's a different thing from the slippage you end up paying, and it's a safety net, not a target: the order still fills at the best prices available, level by level. The numbers worth knowing:
• Hyperliquid's Python SDK sets the tolerance at 5% from the mid price in market_open and market_close unless you pass your own.
• Take-profit and stop-loss orders that trigger as market orders have a 10% tolerance, per Hyperliquid's docs.
• Each slice of a TWAP order, which splits a large order into smaller ones over time, has a 3% maximum.
• A single market order can't be larger than $30 million on markets whose maximum leverage is 25x or more, $5 million from 20x, $2 million from 10x and $500,000 below that. The tiers are in Hyperliquid's contract specifications, and {"type": "maxMarketOrderNtls"} returns them.
Slippage also isn't the fee. The fee is charged on top: 0.045% of the order, or 4.5 basis points, for a taker, meaning an order that fills at once, on Hyperliquid's main exchange at the base tier. That gives you a useful yardstick. When slippage is under 4.5 basis points, the fee is the bigger cost. When it's over, slippage is. The fees guide covers how fees are charged.
What it costs: slippage by market and size
This is a week of estimates, 672 per cell, one every 15 minutes. The first number is the median, the cost at a typical moment. The number in brackets is the 95th percentile, the cost at a bad moment: only one sample in twenty was worse. Everything is a market buy, in basis points from the mid price. Names starting with xyz: are HIP-3 markets, the perps that other teams deploy on Hyperliquid, here stock and commodity perps.
| Market | $1,000 | $10,000 | $100,000 | $1,000,000 |
|---|---|---|---|---|
| BTC | 0.07 (0.35) | 0.07 (0.59) | 0.07 (1.10) | 0.50 (1.95) |
| ETH | 0.22 (0.44) | 0.22 (0.67) | 0.22 (1.31) | 1.09 (2.85) |
| SOL | 0.06 (0.92) | 0.06 (1.27) | 0.51 (2.29) | 2.75 (4.71) |
xyz:SP500 | 0.07 (0.47) | 0.14 (0.65) | 0.49 (1.20) | 1.66 (5.66) |
xyz:GOLD | 0.12 (0.37) | 0.12 (0.85) | 0.59 (2.20) | 3.11 (8.34) |
| HYPE | 0.07 (1.15) | 0.50 (2.19) | 2.24 (4.32) | 8.01 (10.85) |
xyz:NVDA | 0.50 (1.12) | 0.72 (1.58) | 2.00 (3.52) | 9.34 (15.47) |
| ZEC | 0.40 (1.53) | 0.65 (2.45) | 2.87 (5.48) | 11.29 (15.02) |
| UNI | 0.99 (1.98) | 2.18 (3.87) | 7.41 (10.70) | 33.80 (39.04) |
| SOPH | 17.13 (35.51) | 65.44 (119.16) | 4,417 (10,437) | no estimate |
A few things stand out.
On the biggest markets, slippage is smaller than the fee. A $1 million BTC buy typically cost half a basis point, about $50. The taker fee on the same order is $450. Up to $100,000, the median BTC and ETH order filled inside the best offer, so all it paid was half the spread, the distance from the mid price to the best offer.
Size costs more as the market gets smaller. Going from $100,000 to $1 million added less than half a basis point on BTC, about 6 on HYPE and 26 on UNI. On UNI, a $1 million order typically cost 34 basis points, $3,380, more than seven times the fee.
The large xyz markets hold up. A $100,000 buy of xyz:SP500 typically cost half a basis point, and xyz:GOLD about the same. xyz:NVDA was closer to HYPE.
Small markets can't take size at all. On SOPH, $1,000 cost 17 basis points and $100,000 cost 44%, because the order eats deep into a thin book. For $1 million there was no estimate in any of the 672 samples: the book didn't hold that much.
On the deepest markets, a bad moment is many times the typical one. For a $100,000 BTC buy, the median was 0.07 basis points and the 95th percentile was 1.10. On thinner markets the gap is narrower, because the typical cost is already high. If you size orders on the median, you'll be wrong when it matters.
Estimating slippage right now
Hyperliquid API
l2Book returns the order book for one market: up to 20 price levels on each side, each with its price and total size. To estimate a buy, walk up the offers and add them until your order is filled, then compare your average price with the mid:
import requests

def cost_bps(coin, usd, sig=None):
    bids, asks = requests.post("https://api.hyperliquid.xyz/info", json={
        "type": "l2Book", "coin": coin, "nSigFigs": sig}).json()["levels"]
    mid = (float(bids[0]["px"]) + float(asks[0]["px"])) / 2
    left, coins = usd, 0.0
    for px, sz in ((float(a["px"]), float(a["sz"])) for a in asks):
        take = min(left, px * sz)        # dollars filled at this level
        left, coins = left - take, coins + take / px
        if left <= 0:
            return round((usd / coins / mid - 1) * 1e4, 2)

for coin, sig in (("BTC", None), ("HYPE", None), ("HYPE", 4)):
print(coin, "nSigFigs", sig, "->", cost_bps(coin, 1e6, sig), "bps")BTC nSigFigs None -> 0.07 bps
HYPE nSigFigs None -> None bps
HYPE nSigFigs 4 -> 10.29 bpsThe second line is the limit you'll hit. Twenty levels isn't a fixed amount of money. On BTC, the 20 offers held $13.7 million when we looked. On HYPE they held $39,000. The levels sit about as far apart on both markets; there's just far less resting on each one. When the levels run out before the order is full, the function returns nothing.
nSigFigs is the way around it. It groups prices into wider buckets, so 20 levels reach further from the mid. On BTC, the default view reached 2.6 basis points from the mid, nSigFigs: 4 reached 26, and nSigFigs: 3 reached 262. The price you pay is precision. Offers are rounded up to the bucket's price, and the mid in this snippet moves with the buckets too, so the answer gets rougher as the buckets widen. In our BTC test it overstated the cost, by a lot at the widest setting. Use the finest setting that still fits your order.
This is the right tool for a live quote. It's free, it costs 2 of your 1,200 weight a minute, and it's current to the moment you ask.
Hydromancer API
For a live quote on one order, walk Hyperliquid's book as above. What Hydromancer adds here is two requests that give you depth already added up. marketLiquidity returns how much is resting within 2, 5, 10 and 25 basis points of the mid on each side, in coins, one row a second for the last 24 hours:
{"type": "marketLiquidity", "market": "BTC", "limit": 1}currentDepth, a paid add-on, returns depth in dollars within 10, 25, 50, 100, 200 and 500 basis points for every market in one response, or for one DEX if you name it:
{"type": "currentDepth", "dex": "hyperliquid"}That's the one for a screen that ranks markets by how much they can absorb.
Side by side
| Hyperliquid API | Hydromancer API | |
|---|---|---|
| Cost of one order, now | l2Book, then walk the levels yourself | No ready-made request. The newest slippageHistory sample can be up to 15 minutes old |
| Depth near the mid, ready-made | Add up l2Book levels yourself | marketLiquidity: within 2, 5, 10 and 25 basis points, per second, 24 hours back |
| Depth for every market at once | One l2Book request per market | currentDepth (add-on): 179 markets on the main exchange in one response |
| Rate-limit cost | 2 weight of 1,200 a minute per IP | 10 points of 20,000 a minute for marketLiquidity (Growth plan) |
For pricing a single order before it's sent, Hyperliquid's book is all you need.
Slippage history
Hyperliquid API
There's no request for past order books or past slippage. If you want to stay on Hyperliquid alone, record l2Book yourself from today onward, or pull the sampled l2Book snapshots from Hyperliquid's S3 archive at s3://hyperliquid-archive/market_data/, which is uploaded about once a month, requester-pays, with a note in the docs that updates aren't guaranteed and data may be missing.
Hydromancer API
slippageHistory returns the estimated cost of a market buy and a market sell of a given size, sampled every 15 minutes, along with the half spread at that moment. It's the request behind the table above. Here it is for six markets at $100,000:
import os, time, statistics, requests

H = {"Authorization": "Bearer " + os.environ["HYDROMANCER_API_KEY"]}
week_ago = int(time.time() * 1000) - 7 * 86_400_000
for coin in ("BTC", "ETH", "HYPE", "UNI", "xyz:SP500", "xyz:NVDA"):
    rows = requests.post("https://api.hydromancer.xyz/info", headers=H, json={
        "type": "slippageHistory", "coin": coin, "amount": 100000,
        "startTime": week_ago, "limit": 2000}).json()
    buys = sorted(r["buySlippageBps"] for r in rows
                  if r["buySlippageBps"] is not None)
    mid, bad = statistics.median(buys), buys[round(0.95 * (len(buys) - 1))]
    print(f"{coin:9} {len(rows)} samples, median {mid:5.2f} bps,",
          f"95th percentile {bad:5.2f} bps")
time.sleep(2)BTC 672 samples, median 0.07 bps, 95th percentile 1.10 bps
ETH 672 samples, median 0.22 bps, 95th percentile 1.31 bps
HYPE 672 samples, median 2.24 bps, 95th percentile 4.34 bps
UNI 672 samples, median 7.38 bps, 95th percentile 10.70 bps
xyz:SP500 672 samples, median 0.49 bps, 95th percentile 1.20 bps
xyz:NVDA 672 samples, median 2.00 bps, 95th percentile 3.52 bpsWe ran this later than the table, so the week it covers had moved on by a few samples. Two figures shifted with it: HYPE's 95th percentile (4.34 against 4.32) and UNI's median (7.38 against 7.41).
What to know before you build on it:
• Nine sizes. amount has to be one of $1,000, $5,000, $10,000, $30,000, $50,000, $100,000, $250,000, $500,000 or $1,000,000. Any other amount returns an empty list, not an error.
• Missing estimates are null. When the book couldn't fill the size, the field is null. Filter those before you take a median or a maximum, and count them: they're the moments the market couldn't take your order.
• A page is 500 rows unless you ask for more. Pass limit: 2000, the maximum, which is about 20 days. For longer, move startTime past the last row's timestamp.
• It's an estimate from the book at one instant. A real order lands a moment later, and anything can happen in between samples.
• History has a start date. BTC goes back to 3 December 2025, xyz:SP500 to 18 March 2026. Pass a real startTime: with 0, the first rows come back with a zero timestamp.
marketLiquidityHistory is the companion request: the same depth bands as marketLiquidity, averaged per hour and kept past the 24 hours. For BTC it goes back to 10 February 2026.
And if you'd rather compute past slippage your own way, Reservoir, Hydromancer's S3 archive, has a 20-level order book snapshot for every market once a minute, updated daily. There's no Hydromancer fee for it; you pay AWS download charges.
Side by side
| Hyperliquid API | Hydromancer API | |
|---|---|---|
| Past slippage for an order size | No request. Record l2Book yourself, or download the S3 market_data snapshots and compute it | slippageHistory: buy and sell estimate every 15 minutes, nine sizes |
| Past depth | The same recordings | marketLiquidityHistory: hourly averages |
| One week, one market, one size | Not from the API | 672 rows, 1 request, 10 points |
| HIP-3 markets | Live l2Book only | Included |
slippageHistory, marketLiquidity, marketLiquidityHistory and currentDepth are Hydromancer additions, not part of Hyperliquid's original API. Orders still go through Hyperliquid.
When slippage is worst
History is what lets you ask this. We pulled 30 days for a few markets and looked for a pattern.
On BTC there barely is one. The median for a $1 million buy was 0.43 basis points over the month, and the hour-by-hour medians all sat between 0.24 and 0.63. Weekends were no different from weekdays. The worst sample of the month was 4.4 basis points.
Stock perps are another story. They trade around the clock, but the stocks under them don't:
import os, time, statistics, requests

H = {"Authorization": "Bearer " + os.environ["HYDROMANCER_API_KEY"]}
rows = requests.post("https://api.hydromancer.xyz/info", headers=H, json={
    "type": "slippageHistory", "coin": "xyz:NVDA", "amount": 100000,
    "startTime": int(time.time() * 1000) - 20 * 86_400_000,
    "limit": 2000}).json()
week = [[], []]  # weekdays, weekends
for r in rows:  # tm_wday: Monday is 0, Saturday 5, Sunday 6
    weekend = time.gmtime(r["timestamp"] / 1000).tm_wday >= 5
    if r["buySlippageBps"] is not None:
        week[weekend].append(r["buySlippageBps"])
for name, bps in zip(("weekdays", "weekends"), week):
print(name, len(bps), "samples, median", statistics.median(bps), "bps")weekdays 1347 samples, median 1.7 bps
weekends 576 samples, median 2.17 bpsA $100,000 buy of xyz:NVDA cost about a quarter more on weekends, and about a third more over the full 30 days. Over the 30 days, the cheapest hours were 14:00 to 20:00 UTC, which overlap US stock market hours, with medians of 1.36 to 1.50 basis points against 1.70 to 2.03 for the rest of the day. xyz:SP500 showed the same weekend effect more strongly: 0.32 basis points on weekdays, 0.74 on weekends.
If your tool trades stock or index perps in size, the calendar is worth a line of code.
Ways to pay less
None of this is a secret, but the numbers above tell you when each one is worth it.
• Check the cost for your size first. One l2Book request before the order tells you whether you're about to pay half a basis point or fifty.
• Set your own tolerance. The SDK's 5% default is wide for BTC, where the worst sample in a month was 4.4 basis points for $1 million. A tighter limit turns a bad fill into a partial fill.
• Rest a limit order when you can wait. An order that sits in the book doesn't cross the spread and pays the maker fee, 0.015% at the base tier, in place of the taker fee. The cost is that it may not fill.
• Split large orders. Ten $100,000 slices of HYPE at 2.2 basis points each cost less than one $1 million order at 8, as long as the book refills between them. Hyperliquid's built-in TWAP does this for you; the TWAP execution guide covers it.
Which should you use?
| What you're building | Read | Why |
|---|---|---|
| Order ticket showing "estimated slippage" | Hyperliquid l2Book | Free, and current to the moment |
| Check before a bot sends a market order | Hyperliquid l2Book, with nSigFigs for large sizes | Twenty default levels may not hold the order |
| Execution tool picking a slice size | Hydromancer slippageHistory | Shows what each size cost through the day |
| Backtest with estimated trading costs | Hydromancer slippageHistory | An estimate per market, size and 15 minutes, not one flat guess |
| Market screener ranked by liquidity | Hydromancer currentDepth or marketLiquidity | Depth already added up, in one or a few requests |
| Liquidity study over months | Hydromancer marketLiquidityHistory, or Reservoir order books | Hourly depth, or the raw books to compute it yourself |
Test and Validation
Everything above was measured on 10 November 2026 from a machine in Singapore, against Hyperliquid's public API with no key and Hydromancer's API on a Growth plan key. Hydromancer requests were paced at one every 2.5 seconds and Hyperliquid requests 4 seconds apart, inside both APIs' published limits. No orders were placed. Every cost here is an estimate from order book data, not a fill.
What we ran:
• The table. slippageHistory for 10 markets and 4 sizes over 7 days: 40 requests, 672 samples each, 15.0 minutes apart on median, 10 rate-limit points per request. The only missing estimates were on SOPH: 3 of 672 buys and 588 of 672 sells at $100,000, and all of both at $1 million.
• Hyperliquid's book. One l2Book per market, walked for the same four sizes. BTC's 20 offers held $13.7 million and reached 2.6 basis points from the mid; HYPE's held $39,000 and reached 3.8. On BTC with nSigFigs 4 and 3, the 20 offers held $58 million and $183 million and reached 26 and 262 basis points. A $1 million BTC buy walked at 0.07 basis points on the default view and, in separate requests moments later, 0.67 with nSigFigs: 4 and 6.71 with nSigFigs: 3, which is the overstatement described above.
• Do the two agree? We worked out when the next 15-minute sample was due, recorded Hyperliquid's l2Book around that moment, and walked the book closest in time to each new sample, 0.2 to 1.4 seconds apart. For a $1 million BTC buy, Hydromancer's estimate was 1.33 basis points and our walk gave 1.09. For ETH it was 1.66 against 1.03, for xyz:SP500 1.02 against 1.31, and for a $100,000 SOL buy 0.06 against 0.06. Across the seven comparisons the largest difference was 0.63 basis points. An eighth comparison, a $100,000 SOL sell, couldn't be made: the 20 bid levels in Hyperliquid's default view didn't hold $100,000 at that moment, and Hydromancer's estimate was 3.15 basis points. The books weren't taken at the same instant, and on numbers this small a gap of half a basis point is a large share of the estimate. Read the estimates as the right size, not as exact to the hundredth.
• Thirty days. slippageHistory paged over 30 days, 2,883 samples each, for BTC at $1 million and for HYPE, xyz:SP500 and xyz:NVDA at $100,000, grouped by UTC hour and by weekday or weekend. The weekend snippet above uses 20 days so it fits in one request, which is why its weekday median (1.7) differs slightly from the 30-day one (1.6). The 95th percentile throughout is the sample at position 0.95 × (count − 1) in the sorted list, the same rule the snippet uses.
• Depth. marketLiquidity for each market, and 500 consecutive BTC rows a median 959 milliseconds apart. currentDepth returned 179 markets in 79 KB.
• Limits. maxMarketOrderNtls on both APIs returned the same four tiers, which match Hyperliquid's contract specifications. The SDK's 5% default was read from the source of hyperliquid-python-sdk 0.24.0.
• Negative checks. We sent slippageHistory, marketLiquidity, marketLiquidityHistory and currentDepth to Hyperliquid's info endpoint and got the same 422 a made-up request type gets. That proves the names don't exist there, nothing more. The claim that Hyperliquid's API has no slippage or order book history rests on its documented request list.
What we didn't measure: real fills. We didn't send a market order and compare the result with the estimate, so we can't tell you how close the estimates run to what an order pays. We didn't download Hyperliquid's S3 archive or Reservoir; their descriptions come from the docs linked under Sources. The fee rates, the 10% and 3% tolerances and the weight of an l2Book request come from Hyperliquid's docs. The 4.5 basis point taker fee is for Hyperliquid's main exchange; HIP-3 markets set their own.
The code shown in this guide is an example that proves the idea works, not a finished app, so you don't need to copy it line for line. The API requests are exact: the request types, fields and URLs are what each API expects. Feel free to be creative with what you will create!
FAQ
What is slippage on Hyperliquid?
It's the difference between the mid price when you send a market order and the average price the order fills at. It comes from the order taking several price levels in the book, and it grows with order size.
How much slippage does a market order have on Hyperliquid?
It depends on the market and the size. In our week of samples, a $100,000 buy typically cost 0.07 basis points on BTC, 2.2 on HYPE and 7.4 on UNI. A $1 million buy cost 0.5, 8.0 and 33.8.
What is the default slippage for a Hyperliquid market order?
There's no exchange-wide default. Through the API a market order is an IOC limit order, and you choose its price. The official Python SDK uses 5% from the mid price unless you set another value.
How can I see Hyperliquid slippage history?
Hyperliquid's API has no history of order books or slippage. Record l2Book yourself, or use Hydromancer's slippageHistory, which has a buy and sell estimate every 15 minutes for nine order sizes.
Is slippage or the fee the bigger cost on Hyperliquid?
On BTC and ETH, the fee. A $1 million BTC buy typically slipped about $50 against a $450 taker fee at the base tier. On smaller markets and larger sizes, slippage passes the fee.
Related reading
• Hyperliquid fees and revenue: a guide for builders
• How to build a Hyperliquid TWAP execution tool
• BBO vs l2Book vs l4Book: the three views of Hyperliquid's order book
• Hyperliquid tick size and lot size
• Hyperliquid vs Hydromancer API: when to upgrade?
Sources
- Hyperliquid docs: Info endpoint, Order types, Contract specifications, Fees, Historical data, Python SDK
- Hydromancer docs: slippageHistory, marketLiquidity, marketLiquidityHistory, currentDepth, maxMarketOrderNtls, Reservoir order books
Read next

Hyperliquid Open Interest: How It's Counted, Live Data and History
What open interest means on Hyperliquid, why the reported number counts both sides, how to read it live, how caps work and where to get the history.
Hyperliquid Mempool: Guides and Best Streaming Practices
The Hyperliquid mempool is the set of transactions waiting for the next block. What it holds, who can see it, and how a node streams it to disk.

Hyperliquid Fills vs Trades: What's the Difference?
A Hyperliquid trade is one match; a fill is one wallet's side of it. What each record holds, why one trade makes two fills, and which API gives you each.