Hyperliquid Open Interest: How It's Counted, Live Data and History
What open interest means on Hyperliquid, why the reported number counts both sides, how to read it live, how caps work and where to get the history.

Open interest is the total size of the positions still open in a market. Volume tells you how much traded today. Open interest tells you how much is still held open at any moment, and it's the number people watch to judge how much money is committed to a market and how crowded it is.
Hyperliquid open interest stood at $13.67 billion when we checked, spread over 349 perp markets. (A perp is a futures contract with no expiry date. It's most of what trades on Hyperliquid.) BTC alone was $3.13 billion. There's a catch in how that number is counted, though: Hyperliquid adds up the long side and the short side, so every contract is in there twice. Count each contract once and the total is $6.83 billion. Miss that, and a comparison with any source that counts each contract once is off by a factor of two.
Every number in this article comes from tests we ran on 10 November 2026. The method and the full results are in Test and Validation near the end.
Which numbers your app needs
If you're showing a market's current open interest, Hyperliquid's own API has it, free, for every market in one request. If you're warning traders before an order gets rejected, you want the list of markets sitting at their open interest cap, which Hyperliquid's API also has. The gap is the past. A chart of open interest over the last month, a "how did positioning change into this move" study, a backtest that uses open interest as a signal: all of those need history, and Hyperliquid's API only reports the present.
That's the part further down where Hydromancer comes in.
How Hyperliquid counts open interest
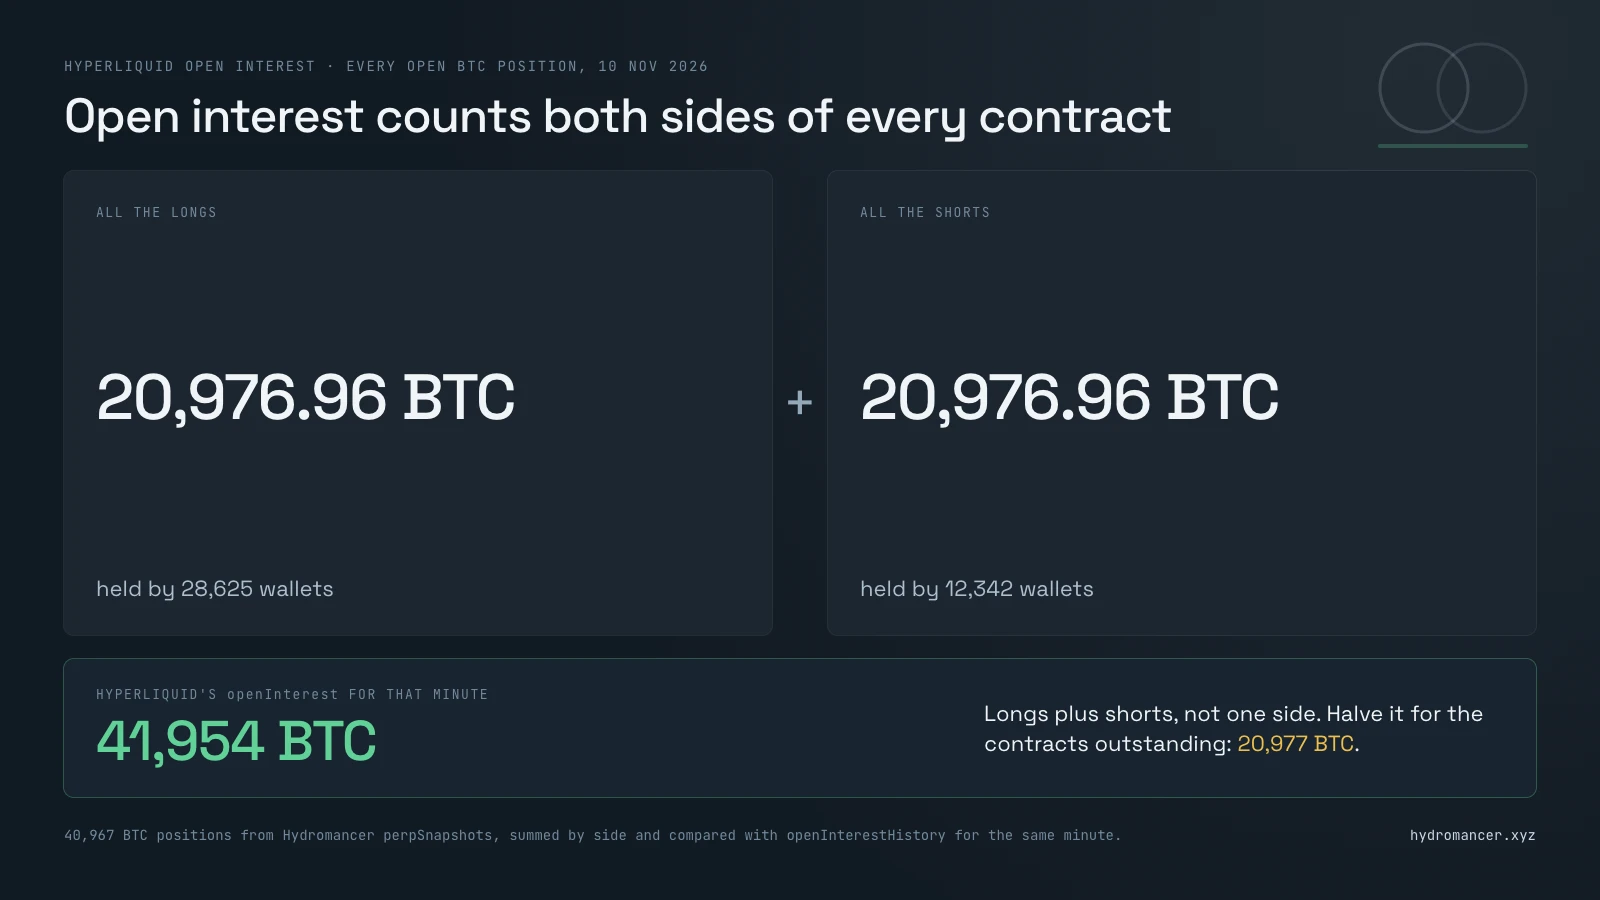
Every contract has a buyer and a seller, so across a market the longs always add up to exactly the shorts. That means open interest can be counted two ways: each contract once, or both sides of it. Hyperliquid's openInterest field counts both sides.
We checked this the direct way. Using Hydromancer's perpSnapshots, a paid add-on that returns every open position in a market, we took all 40,967 open BTC positions and added up each side. Then we did the same for ETH and HYPE:
| BTC | ETH | HYPE | |
|---|---|---|---|
| Wallets long | 28,625 | 12,780 | 14,403 |
| Wallets short | 12,342 | 6,612 | 5,766 |
| Total size of the longs | 20,976.96 | 399,735.09 | 10,826,170.42 |
| Total size of the shorts | 20,976.96 | 399,735.09 | 10,826,170.42 |
| Longs plus shorts | 41,953.93 | 799,470.18 | 21,652,340.84 |
Open interest for that minute, low to high (openInterestHistory) | 41,952.56 to 41,957.28 | 799,469.12 to 799,473.33 | 21,651,371.30 to 21,652,392.98 |
The longs and the shorts match to the last decimal, as they must. And the reported open interest is the two added together, not one of them. So when BTC shows 41,954 BTC of open interest, there are 20,977 BTC of contracts outstanding.
Two more things about the unit:
• It's in coins, not dollars. openInterest for BTC is a number of BTC. To get dollars, multiply by the mark price, which is Hyperliquid's own fair price for the perp. The oracle price vs mark price guide covers how that price is set.
• The dollar figure moves with price. If nobody opens or closes anything and BTC rises 5%, open interest in dollars rises 5% too. When you want to know whether traders are adding positions, read it in coins.
That second point isn't a technicality. Between 1 August 2025 and the day we tested, BTC open interest in coins rose 30%, from 32,164 to about 41,900 BTC. In dollars it fell 14%, from $3.64 billion to $3.13 billion, because the price was lower. Same market, same dates, opposite conclusions depending on the unit.
Reading open interest right now
Hyperliquid API
metaAndAssetCtxs returns every perp on Hyperliquid's main exchange in one request: the list of markets, and for each one its open interest, mark price, oracle price, funding and 24-hour volume. This adds it up:
import requests

meta, ctxs = requests.post("https://api.hyperliquid.xyz/info",
                           json={"type": "metaAndAssetCtxs"}).json()
rows = [(a["name"], float(c["openInterest"]) * float(c["markPx"]))
        for a, c in zip(meta["universe"], ctxs) if not a.get("isDelisted")]
rows.sort(key=lambda r: -r[1])
total = sum(usd for _, usd in rows)
print(len(rows), "markets, open interest $%.2fB" % (total / 1e9))
print("counting each contract once: $%.2fB" % (total / 2e9))
for coin, usd in rows[:5]:
print(f"{coin:5} ${usd / 1e9:.2f}B {usd / total:.0%}")179 markets, open interest $9.16B
counting each contract once: $4.58B
BTC $3.13B 34%
ETH $1.69B 18%
HYPE $1.61B 18%
ZEC $0.49B 5%
SOL $0.41B 4%The check for isDelisted matters. The request lists 235 markets, and 56 of them are delisted ones that still appear with zero open interest.
That covers the main exchange. Hyperliquid also hosts HIP-3 DEXes, perp exchanges that other teams deploy, like the stock and commodity perps on xyz. Each one is a separate request: add "dex": "xyz" to the same body, and get the list of DEX names from {"type": "perpDexs"}. For a live view, the activeAssetCtx stream sends one market's numbers about once a second, and allDexsAssetCtxs sends every market on every DEX in one subscription.
Hydromancer API
assetContext takes up to 20 market names and returns open interest, the mark, oracle and mid prices and 24-hour volume for each, keyed by name. It doesn't include funding. The names can come from different DEXes in the same request:
{"type": "assetContext", "coins": ["BTC", "xyz:SP500", "para:TOTAL2"]}The open interest it returns is Hyperliquid's number, counted the same two-sided way.
Side by side
| Hyperliquid API | Hydromancer API | |
|---|---|---|
| Every market on one DEX | metaAndAssetCtxs: 1 request (179 live markets on the main exchange, 73 KB) | Not what assetContext is for |
| A few named markets | The same full response, filtered by you | assetContext: up to 20 names, from any DEX (BTC, ETH and HYPE came back in 545 bytes) |
| Every market on every DEX | 11 requests, one per DEX, or the allDexsAssetCtxs stream | See the sector totals under history, below |
| Rate-limit cost | 20 weight of 1,200 a minute per IP | 2 points of 20,000 a minute (Growth plan) |
For a full market table, Hyperliquid's request is the right tool and it's free. assetContext is for the opposite case, a watchlist of a few markets spread over several DEXes.
Open interest caps
Each market has a ceiling on its open interest. When a market reaches it, Hyperliquid stops orders that would push it higher. Hyperliquid's docs list the rejections. An order that would grow a position, or flip it to the other side, gets Order would increase open interest while open interest is capped. An order priced more aggressively than the oracle price gets Order rejected due to price more aggressive than oracle while at open interest cap. There's a separate speed limit too: Order would increase open interest too quickly.
perpsAtOpenInterestCap lists the markets at their cap right now. When we ran it, the main exchange returned eight names. Seven were delisted markets with nothing open. The one live market was SOPH, with $0.47 million of open interest.
For HIP-3 DEXes the caps themselves are public. perpDexLimits returns the cap for the whole DEX and for each market, in dollars, which lets you show how full a market is before it gets there:
import requests

def info(body):
    return requests.post("https://api.hyperliquid.xyz/info", json=body).json()

caps = dict(info({"type": "perpDexLimits", "dex": "xyz"})["coinToOiCap"])
meta, ctxs = info({"type": "metaAndAssetCtxs", "dex": "xyz"})
used = []
for a, c in zip(meta["universe"], ctxs):
    usd = float(c["openInterest"]) * float(c["markPx"])
    if a["name"] in caps:
        used.append((usd / float(caps[a["name"]]), a["name"], usd))
for share, coin, usd in sorted(used, reverse=True)[:5]:
    print(f"{coin:12} ${usd / 1e6:6.1f}M open, {share:.0%} of its cap")
print("at cap now:", info({"type": "perpsAtOpenInterestCap", "dex": "xyz"}))xyz:IBM $ 29.3M open, 59% of its cap
xyz:ANT $ 82.2M open, 55% of its cap
xyz:NVDA $ 248.1M open, 50% of its cap
xyz:NATGAS $ 47.5M open, 48% of its cap
xyz:PURRDAT $ 21.9M open, 44% of its cap
at cap now: []On xyz the DEX-wide cap was $10 billion and the per-market caps ran from $20 million to $1.25 billion. No market was at its cap; the fullest was at 59%. The deployer sets these and can change them, so read them fresh instead of hardcoding them.
For the main exchange, perpDexLimits returns null, and we didn't find a request that gives the cap values there. You can see which markets are at the cap, not how far the others are from it.
Both requests in this section work the same way on Hydromancer's API and returned the same answers in our test.
Open interest history
Hyperliquid API
There's no request for past open interest. metaAndAssetCtxs and the streams report the current value and nothing else.
If you want to stay on Hyperliquid alone, you have two options. Record the stream yourself from today onward; in our 60-second listen, BTC's open interest changed 31 times, so a reading every few seconds is plenty for a chart. Or pull Hyperliquid's S3 archive: s3://hyperliquid-archive/asset_ctxs/[date].csv.lz4 holds daily asset context files, uploaded about once a month, requester-pays, with a note in the docs that updates aren't guaranteed and data may be missing.
Hydromancer API
openInterestHistory returns open interest as a time series, in buckets from one minute to one month, starting 1 August 2025. Like every Hydromancer request, it needs an API key, which the snippets read from the HYDROMANCER_API_KEY environment variable. Each row has the open, high, low and close of open interest inside the bucket, in coins, plus the dollar value at the close:
import os, time, requests

H = {"Authorization": "Bearer " + os.environ["HYDROMANCER_API_KEY"]}
rows = requests.post("https://api.hydromancer.xyz/info", headers=H, json={
    "type": "openInterestHistory", "coin": "BTC", "interval": "1d",
    "startTime": 0}).json()
peak = max(range(len(rows)), key=lambda i: float(rows[i]["oiUsd"] or 0))
print(len(rows), "daily rows")
for r in (rows[0], rows[peak], rows[peak + 1], rows[-1]):
    day = time.strftime("%d %b %Y", time.gmtime(r["t"] / 1000))
    print(day, f"{float(r['oiClose']):>8,.0f} BTC",
f"${float(r['oiUsd']) / 1e9:.2f}B")467 daily rows
01 Aug 2025 32,164 BTC $3.64B
09 Oct 2025 37,477 BTC $4.56B
10 Oct 2025 19,569 BTC $2.21B
10 Nov 2026 41,886 BTC $3.13BThat's every day since the data starts, in one request. The second and third lines are the reason to keep history at all. On 9 October 2025 BTC open interest closed at its highest dollar value in the series. One day later it was half that: 37,477 BTC down to 19,569. BTC's price fell about 7% that day by the same rows, so nearly all of the drop was positions being closed or liquidated, not the price moving. You can't see that from a live number.
The same request takes a sector instead of a coin and returns the total in dollars for a group of markets. There are three keywords, total for everything, native for Hyperliquid's main exchange and hip3 for all the HIP-3 DEXes together, or you can pass the name of one DEX:
import os, time, requests

H = {"Authorization": "Bearer " + os.environ["HYDROMANCER_API_KEY"]}
start = int(time.time() * 1000) - 365 * 86_400_000
for sector in ("total", "native", "hip3", "xyz"):
    rows = requests.post("https://api.hydromancer.xyz/info", headers=H, json={
        "type": "openInterestHistory", "sector": sector, "interval": "1d",
        "startTime": start}).json()
    rows = [r for r in rows if float(r["oiUsdClose"]) > 0]
    then, now = float(rows[0]["oiUsdClose"]), float(rows[-1]["oiUsdClose"])
    print(f"{sector:6} a year ago ${then / 1e9:5.2f}B  now ${now / 1e9:5.2f}B")
time.sleep(2)total a year ago $ 8.36B now $13.67B
native a year ago $ 8.31B now $ 9.16B
hip3 a year ago $ 0.05B now $ 4.51B
xyz a year ago $ 0.05B now $ 4.30BA year ago HIP-3 markets were under 1% of Hyperliquid's open interest. Now they're a third of it, and almost all of that is xyz. Sector rows are in dollars only, because you can't add BTC contracts to gold contracts.
A few things to know before you build on it:
• A request returns at most 5,000 buckets. Ask for more, say one-minute buckets over 30 days, and you get an error telling you to use a wider interval or a shorter range, not a cut-off response.
• Skip zero values in sector rows. One day in the series, 21 July 2026, came back as zero for every sector, which is why the snippet above filters them out.
• Spot markets have no open interest. Asking for one returns @107 has no open interest.
• HIP-3 markets start when the market did. xyz:GOLD begins on 22 December 2025.
• Nothing is earlier than 1 August 2025. For older data, Hyperliquid's S3 archive is the place to look.
• openInterestHistory is a Hydromancer addition, not part of Hyperliquid's original API. Orders still go through Hyperliquid.
Side by side
| Hyperliquid API | Hydromancer API | |
|---|---|---|
| Past open interest for one market | No request. Record the stream yourself, or download the S3 asset_ctxs daily files | openInterestHistory with coin: 467 daily rows since 1 August 2025 in 1 request |
| Finest detail | Whatever you recorded | One-minute buckets, with the high and low inside each |
| Total across markets, over time | Add it up yourself, per DEX, from your own recordings | openInterestHistory with sector |
| Rate-limit cost | Not applicable | 5 points of 20,000 a minute (Growth plan) |
The two APIs agree on the present. We compared the latest one-minute bucket with Hyperliquid's live number a few seconds later: 41,940.10 BTC against 41,939.31. And the all-DEX total we added up from Hyperliquid's 11 requests, $13.669 billion, matched the total sector, $13.667 billion.
There's also a third route if you'd rather work from files. Reservoir, Hydromancer's S3 archive, has a daily snapshot of every open position, which is enough to compute open interest per market per day yourself. There's no Hydromancer fee for it; you pay AWS download charges.
Which should you use?
| What you're building | Read | Why |
|---|---|---|
| Market table with current open interest | Hyperliquid metaAndAssetCtxs | Every market on a DEX in one free request |
| Live ticker for one market | Hyperliquid activeAssetCtx stream | Updates about once a second |
| Watchlist across several DEXes | Hydromancer assetContext | Up to 20 names from any DEX in one request |
| "This market is full" warning | perpsAtOpenInterestCap, plus perpDexLimits for HIP-3 | Tells you before the order is rejected |
| Open interest chart since August 2025 | Hydromancer openInterestHistory | Hyperliquid's API has no history request |
| Backtest that uses open interest | Hydromancer openInterestHistory | One-minute detail since August 2025 |
| Anything before August 2025 | Hyperliquid's S3 asset_ctxs files | The only source that goes back further |
| HIP-3 vs main exchange share over time | Hydromancer openInterestHistory with sector | The totals are already added up |
Test and Validation
Everything above was measured on 10 November 2026 from a machine in Singapore, against Hyperliquid's public API with no key and Hydromancer's API on a Growth plan key. Hydromancer requests were paced at one every 2.5 seconds and Hyperliquid requests 4 seconds apart, inside both APIs' published limits.
What we ran:
• Current open interest. One metaAndAssetCtxs call: 235 markets, 179 of them live, $9.16 billion on the main exchange, with BTC, ETH and HYPE making up 70% of it. Then the same call for each of the 10 HIP-3 DEXes, four of which had live markets. All 11 requests together: 349 live markets, $13.669 billion.
• One side or two. Hydromancer's perpSnapshots, a paid add-on that returns every open position in a market, for BTC, ETH and HYPE. We summed the positive and negative sizes separately and compared the sum of both with the one-minute openInterestHistory bucket covering the snapshot's timestamp. In all three markets longs equaled shorts, and longs plus shorts fell inside that minute's low-to-high range.
• Live. 60 seconds on Hyperliquid's activeAssetCtx stream for BTC: 60 messages, 31 changes in open interest.
• Caps. perpsAtOpenInterestCap for the main exchange and for xyz, and perpDexLimits for xyz, on both APIs. Identical answers. perpDexLimits with an empty DEX name returned null on Hyperliquid.
• History. openInterestHistory for BTC at daily, hourly and one-minute intervals (467, 721 and 121 rows, 5 rate-limit points each), for xyz:GOLD, and for the four sectors. One daily row in each sector series, 21 July 2026, came back as zero while the per-market BTC row for that day was normal.
• Agreement. assetContext for BTC, ETH and HYPE against Hyperliquid's numbers fetched three seconds earlier: within 0.05 BTC, 0.5 ETH and 22 HYPE, the size of a few seconds of trading.
• Negative checks. We sent openInterestHistory to Hyperliquid's info endpoint and got the same 422 a made-up request type gets. That proves the name doesn't exist there, nothing more. The claim that Hyperliquid's API has no open interest history rests on its documented request list and on what metaAndAssetCtxs returns.
What we didn't measure: what happens to an order at the cap. We didn't place one. The rejection messages come from Hyperliquid's error documentation, linked under Sources, as does the description of the S3 archive, which we didn't download. We also didn't check how other exchanges count their open interest, so check the convention of whatever you're comparing with. Rate limits quoted in the tables are from the two APIs' docs on the test date.
The code shown in this guide is an example that proves the idea works, not a finished app, so you don't need to copy it line for line. The API requests are exact: the request types, fields and URLs are what each API expects. Feel free to be creative with what you will create!
FAQ
What is open interest on Hyperliquid?
It's the total size of all open positions in a perp market. Hyperliquid reports it per market in coins, in the openInterest field, and counts the long side and the short side together.
Is Hyperliquid open interest one-sided or two-sided?
Two-sided. In our test, the BTC longs added up to 20,977 BTC, the shorts to the same, and the reported open interest was 41,954 BTC. Halve it to get contracts outstanding.
How do I get historical open interest for Hyperliquid?
Hyperliquid's API reports the current value only. Record it yourself, download the daily S3 asset_ctxs files, which are uploaded about once a month, or use Hydromancer's openInterestHistory, which goes back to 1 August 2025 in buckets from one minute to one month.
What happens when a market hits its open interest cap?
Orders that would increase open interest are rejected, per Hyperliquid's docs. perpsAtOpenInterestCap lists the markets at their cap.
What's the difference between open interest and volume?
Volume counts what traded over a period. Open interest counts the positions still open at one moment. A market can trade a lot with little open interest if traders open and close within the day.
Related reading
• Hyperliquid oracle price vs mark price: the price that turns open interest into dollars
• Hyperliquid liquidation data: how it works and the API
• Hyperliquid funding rates: how they work and their history
• Top HIP-3 market deployers by the numbers
• Hyperliquid vs Hydromancer API: when to upgrade?
Sources
- Hyperliquid docs: Perpetuals info requests, Error responses, HIP-3: Builder-deployed perpetuals, Historical data, Subscriptions
- Hydromancer docs: assetContext, openInterestHistory, perpsAtOpenInterestCap, perpDexLimits, Reservoir snapshots
Read next

Hyperliquid Slippage: What a Market Order Costs by Market and Size
Measured slippage on Hyperliquid for $1,000 to $1 million market orders on BTC, ETH, HYPE and HIP-3 markets, plus how to estimate it for your own order.
Hyperliquid Mempool: Guides and Best Streaming Practices
The Hyperliquid mempool is the set of transactions waiting for the next block. What it holds, who can see it, and how a node streams it to disk.

Hyperliquid Fills vs Trades: What's the Difference?
A Hyperliquid trade is one match; a fill is one wallet's side of it. What each record holds, why one trade makes two fills, and which API gives you each.