How to Query Reservoir's Hyperliquid Data
Explore Reservoir's Hyperliquid fills, candles, snapshots and order books, with tested examples for pulling only the markets, wallets and time ranges you need.
Say ETH drops sharply in a few minutes and you want to know what happened. Or you have a trading idea and want to see how it would have done last month before you put money on it. Or you want to know what a particular wallet was holding last week.
All three need historical data, but not the same data. Individual trades tell you what happened during the drop. Price candles are enough to test a trading idea. A snapshot shows what a wallet held at a given moment. Pick the right one and you skip pulling a lot of data you'll never look at.
Reservoir is Hydromancer's archive of Hyperliquid history. It has trades (called fills), price candles, snapshots of positions and balances, and order-book snapshots, all stored on Amazon S3.
This guide goes through each one: what it is, what you'd use it for, and how to pull out only the piece you need. Each section starts with the kind of question you'd bring to it.
The field lists and code come after, so you can skip those until you're ready.
What format is Reservoir data in?
Reservoir stores everything as Parquet files.
Think of Parquet as a compressed table built for analysis. You don't open it like a spreadsheet, but tools such as DuckDB can read it directly. Fills and candles are stored as rows of trades or price bars.
Snapshots record positions, balances or order-book levels at the moment they were taken.
The useful part is that DuckDB can query a Parquet file while it's still sitting on S3. It reads only the columns you ask for and can often skip parts of the file that can't match your filter.
You then save the result on your computer as a smaller Parquet file, or as a CSV you can open in a spreadsheet.
Choose the dataset that matches your question
| What do you want to know? |
Start with | What one row represents |
|---|---|---|
| What trades happened, and at what prices? | Fills | One trade, seen from one wallet's side |
| How did the price and trading activity change? | Candles | One second of a market's prices and volume |
| Which positions were open at a given moment? | Perp position snapshots | One wallet's position in one market |
| Which spot tokens did wallets hold? | Spot balance snapshots | One wallet's balance of one token |
| How much margin backed an account's positions? | Account-value snapshots | One wallet's margin and exposure on one trading venue |
| What bids and asks were waiting at a given minute? | Order-book snapshots | The buy and sell levels for one market at one moment |
A quick note on terms. "Perps" are perpetual futures: contracts that follow a token's price and never expire. "Spot" means holding the token itself.
The SQL examples below all use the Python setup in "How to query S3 and save only the result", further down. If you're not running code yet, you can skip them and still follow along.
1. Fills: what actually traded
A fill is one trade, seen from one account's side. It records what was traded, the price, the size, when it happened, which wallet it was and the fee paid. It also records realised profit or loss, and flags special cases such as liquidations and TWAP trades (large orders split into smaller pieces over time).
Understanding a sudden price drop
Say ETH falls hard and you want to know what was behind it. Start with the ETH liquidation fills around that time. A liquidation is when a position gets forcibly closed because the account no longer has enough margin (collateral) to keep it open.
Group those liquidations by minute and line them up against the price. You'll see when forced closing picked up and how large the closed positions were. For the wider picture, pull the regular fills for the same window too.
That's enough for a market recap or a risk dashboard. Just be careful with the conclusion: liquidations happening during a drop doesn't mean they caused all of it.
Reviewing a wallet's trades
If you're reviewing your own trading, or following another wallet, filter the fills by wallet address. You get the actual price, size and fee of each trade, instead of guessing from where the chart was.
That works well for a trading journal or for checking how well your orders were filled. For the account's full return you'll need more than fills, because funding payments, deposits and withdrawals all affect it too.
What the format looks like
| Field | Meaning |
|---|---|
coin | The market, such as ETH.Markets launched through HIP-3 carry their DEX as a prefix |
timestamp | When the trade happened, in UTC, to the millisecond |
price, size | The trade's price and quantity |
address | The wallet on this side of the trade |
side, crossed | Buy or sell, and whether this side took an order already on the book |
trade_id | The trade's ID, handy for matching up its two sides |
fee, fee_token | The fee charged and the token it was paid in |
is_liquidation, liquidation_method | Whether the fill was part of a liquidation, and how it was handled |
The full schema has more columns, and some of them are empty when they don't apply to a fill.
Fetch only the part you need
Fills for Hyperliquid's own perp markets are stored in one file per day:
by_dex/hyperliquid/fills/perp/all/date=YYYY-MM-DD/fills.parquetThere are also smaller daily files for particular kinds of fills: liquidations, adl, builder_fills and twap_fills. These are cut out of the all file, so don't add them on top of it. A file only exists for a day that had at least one matching fill.
So if you only want liquidations, start with the liquidation file instead of the full day of trades. Then narrow it down to the market, the time window and the columns you need. Whether you're looking into a sell-off or a single wallet, you don't need every account on every market.
The worked example further down pulls only ETH liquidations between 15:30 and 15:40 UTC.
To peek at ordinary ETH trades in one minute, this query keeps only the side that crossed (the taker) and returns up to 50 rows:
SELECT coin, timestamp, price, size, side, crossed
FROM read_parquet('s3://hydromancer-reservoir/by_dex/hyperliquid/fills/perp/all/date=2026-10-08/fills.parquet')
WHERE coin='ETH'
  AND timestamp>=TIMESTAMPTZ '2026-10-08 15:35:00+00'
  AND timestamp<TIMESTAMPTZ '2026-10-08 15:36:00+00'
  AND crossed
ORDER BY timestamp
LIMIT 50;
LIMIT 50 makes this a preview, not every trade in that minute.
For one wallet's history, filter by address and leave out the crossed filter. Otherwise you'll drop every trade where the wallet's order was the one already waiting on the book.
If you're adding up trading volume, remember that a trade normally appears twice, once for each side. Add up every row and you'll double the real figure. A small number of rows are special events rather than ordinary trades, so count those separately.
2. Candles: price and volume over time
A candle sums up trading over a short slice of time. Reservoir's candles cover one second each and record four prices: the first (open), the highest (high), the lowest (low) and the last (close). They also record the volume and the number of trades.
Testing a trading idea before using real money
Say your rule is simple: buy when the price climbs above its recent average, and sell when it drops back below. Before you put money behind it, you want to know when it would have traded and how it would have done.
Pull candles for the market and dates you want to test, then step through them in order, using only prices the rule could have seen at the time. That's backtesting: replaying history to see what a strategy would have done, without placing any real orders. The official Hyperliquid API only returns the most recent 5,000 candles, so longer tests need an archive like this one.
The answer is often that the idea doesn't hold up. It trades too often, gets hurt in sharp moves, or the profit disappears once fees and funding are counted. Better to find that out here than with real money. Keep in mind that a price in the history doesn't mean your order would have filled there, so allow for some slippage (getting a slightly worse price than you expected).
Building a chart or comparing market conditions
Candles are also what you'd use to draw a historical price chart, or to compare how much a market moved on a quiet day against a busy one. They're much easier to work with than millions of individual trades. If you later want the actual trades behind a candle, go back to the fills.
What the format looks like
| Field | Meaning |
|---|---|
coin, asset_class | The market and its type, such as perp |
timestamp | When the one-second candle starts, in UTC |
open, high, low, close | The first, highest, lowest and last price in that second |
volume | Amount traded, counted in the token itself (for example, ETH) |
volume_quote | Amount traded, counted in the currency it's priced in |
trade_count | Number of trades in that second |
Candles come in one daily file per DEX. Filter it by market, type and time. This query pulls five minutes of ETH perp candles rather than every market for the whole day:
SELECT coin, timestamp, open, high, low, close, volume, volume_quote, trade_count
FROM read_parquet('s3://hydromancer-reservoir/by_dex/hyperliquid/candles/1s/date=2026-10-08/candles.parquet')
WHERE coin='ETH'
  AND asset_class='perp'
  AND timestamp>=TIMESTAMPTZ '2026-10-08 15:30:00+00'
  AND timestamp<TIMESTAMPTZ '2026-10-08 15:35:00+00'
ORDER BY timestamp;
Quiet seconds may have no row, so five minutes won't necessarily give you 300 rows. Check which seconds are missing before you fill gaps, and don't invent trades to fill them.
You can roll one-second candles up into minutes or hours. Take the first open and the last close (sorted by time), the highest high, the lowest low, and add up the volume. If your work depends on exact wicks, or on which price was reached first, check it against the underlying fills as well.
3. Snapshots: what positions and balances looked like
Fills tell you what happened. Snapshots tell you what was there: the positions and balances recorded at one moment. Reservoir has daily snapshots of perp positions, spot balances and account values. Some dates are missing, so check what's available instead of assuming every day exists.
Snapshots matter because trades alone don't show what a wallet already held. It may have opened a position weeks before the period you're looking at. A snapshot shows you that position directly.

Each snapshot file is named after the block number and the time it was taken:
{block}_{timestamp}.parquetCheck that time before you match a snapshot to an event. Sitting in a date's folder doesn't mean it was taken at the minute you care about.
Perpetual positions
Checking where large positions are concentrated previouslySay you're looking at BTC and want to know whether a handful of wallets hold most of the big bets. A position snapshot lists the open positions at the moment it was taken. A long makes money when the price goes up; a short makes money when it goes down.
From there, check whether a small group of wallets holds a large share of the longs or the shorts. That works for a concentration study or a dashboard of the biggest positions. It won't tell you who owns the wallets, or what they hold elsewhere.
If you're comparing against a sell-off, check the snapshot time first so you know whether you're looking at before or after. One snapshot a day can't show what changed in between.
Each row is one wallet's position in one market. Useful fields include user, market, size (positive for long, negative for short), notional (the position's recorded value), entry_price, an estimated liquidation_price, leverage settings and account_mode. Sizes and money amounts are stored as floating-point numbers, and the liquidation price can be empty.
This preview pulls five BTC positions from one day's snapshot:
SELECT "user", market, size, notional, entry_price, liquidation_price, leverage_type, leverage, account_mode
FROM read_parquet('s3://hydromancer-reservoir/by_dex/hyperliquid/snapshots/perp/date=2026-10-08/*.parquet')
WHERE market='BTC'
LIMIT 5;
The * only matches files in that one day's folder. It's there because the file name includes the block and time, not to search the whole archive.
Spot balances
Each row is one wallet's balance of one token, and only balances above zero are included. Fields include user, token, balance and entry_value.
To see how a wallet's HYPE balance changed, pull that wallet and token from two snapshots and compare them. If you're studying how a token is spread across holders instead, take that one token across all wallets.
A bigger balance doesn't always mean the wallet bought more. It could have come from a transfer or a deposit.
Either way, fetch only the wallet and token you need for the dates you need, not every token in every wallet.
To preview USDC balances:
SELECT "user", token, balance, entry_value
FROM read_parquet('s3://hydromancer-reservoir/global/snapshots/spot/date=2026-10-08/*.parquet')
WHERE token='USDC'
LIMIT 5;
Account values
Each row is one wallet on one DEX, with fields including user, dex, collateral_token, account_value, total_long_notional, total_short_notional and account_mode.
Position size only tells you part of the risk. You also want to know how much margin (the money backing those positions) the account had, next to its total long and short exposure.
The account-value snapshot puts those numbers in one row. You can build an account overview or a risk report from it without working through every trade.
Keep the collateral token and account mode next to every number. Here, a DEX means a trading venue on Hyperliquid, and different venues can use different collateral, so an account value isn't automatically the wallet's whole balance in USD. And a higher value in the next snapshot isn't necessarily profit, because a deposit would have the same effect.
To preview the fields:
SELECT "user", dex, collateral_token, account_value, total_long_notional, total_short_notional, account_mode
FROM read_parquet('s3://hydromancer-reservoir/global/snapshots/account_values/date=2026-10-08/*.parquet')
LIMIT 5;
To look at one account, filter on the "user" column, keeping the double quotes because user has a special meaning in SQL. To look at one DEX, add a dex filter. These five-row queries are previews, not full lists or rankings. For account-level totals, use this dataset rather than adding up an account value that repeats across position rows.
4. Order books: the bids and asks waiting to be filled
An order book is the list of orders waiting to be filled. Bids are orders to buy and asks are orders to sell. The gap between the highest bid and the lowest ask is the spread.
Reservoir takes a snapshot of each order book once a minute. These are L2 snapshots, which means orders at the same price are grouped into a single level instead of being listed one by one. Each snapshot holds up to 20 levels on each side. It won't show every order, or every change between one snapshot and the next. For every update as it happens, use a live feed instead.
Understanding why a larger trade might get a worse price
The last traded price doesn't tell you how much you could actually buy or sell at that price. A big order can use up everything at the best price and carry on into worse ones.
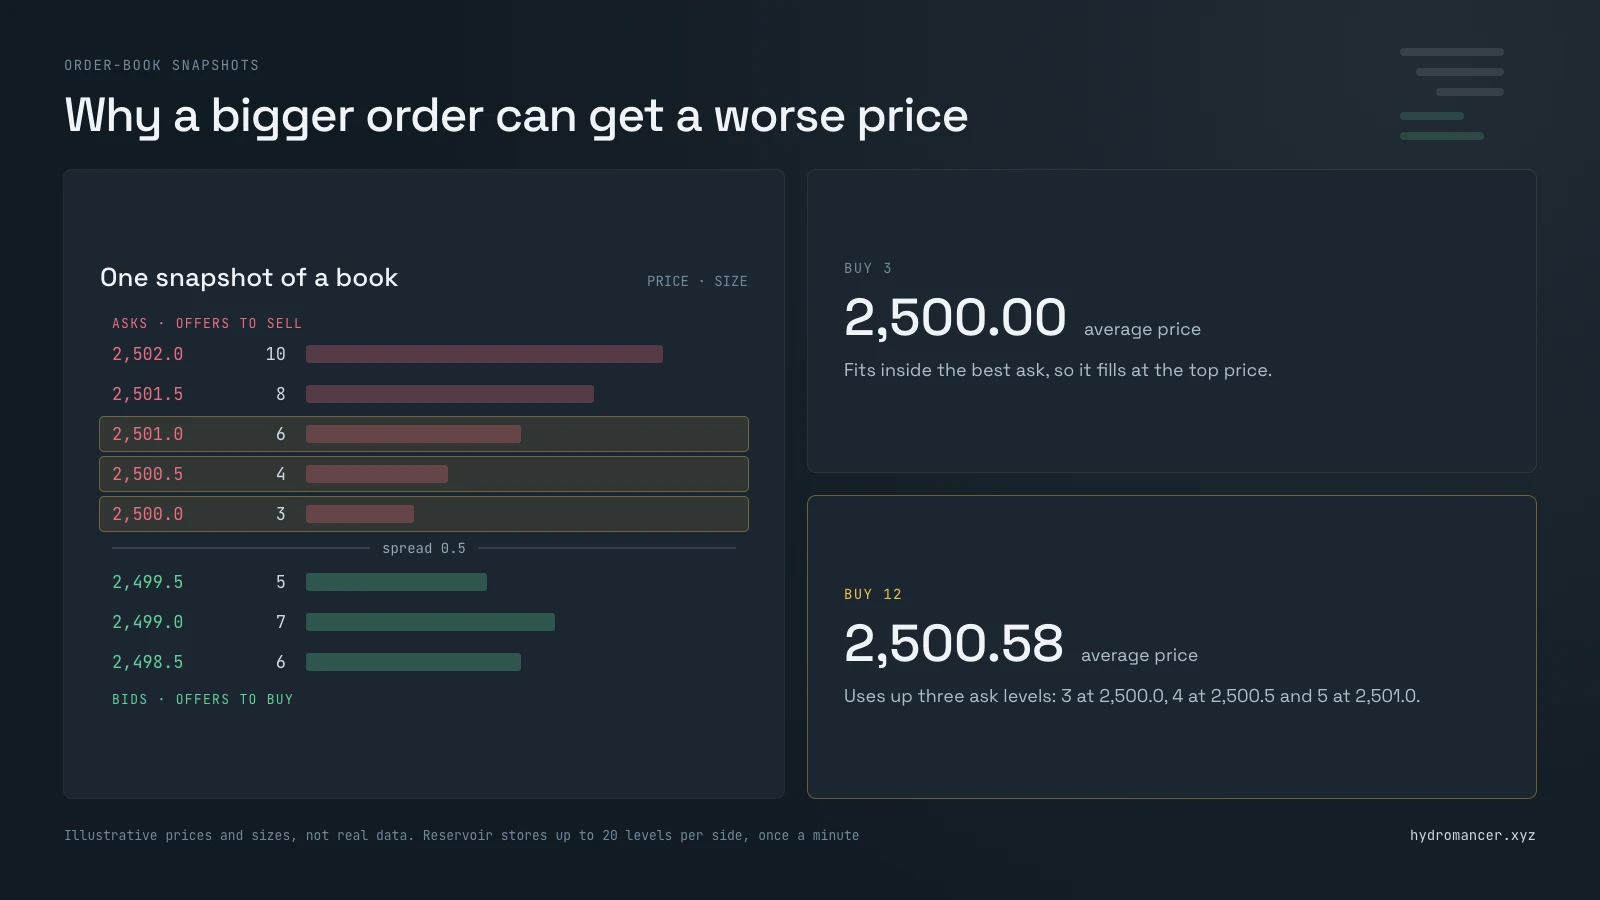
Look at how much is on offer at each price level, and compare the spread when the market is calm with when it's busy. That's useful for a trading tool, or for working out what large trades really cost.
To look at ETH around a sharp move, take the ETH order-book file for that day and pull the minutes around it. Check whether the spread widened and whether the size near the best prices thinned out.
This shows what the book looked like at each snapshot. It isn't the price your own order would have got: orders change between snapshots, and the data can't show where you'd have stood in the queue.
What the format looks like
| Field | Meaning |
|---|---|
block_time_ms | When the snapshot was taken, in milliseconds since 1 January 1970 (UTC) |
block_number | The Hyperliquid block number |
bids | The buy levels, best price first |
asks | The sell levels, best price first |
Each level's px, sz, n | Price, size and number of orders. Price and size are stored as text |
Unlike fills and candles, order books are already split into one file per coin per day. If you only care about one market, that's exactly what you want.
by_dex/hyperliquid/orderbook/1m/perps/date=2026-10-08/ETH.parquetThis pulls the best bid, the best ask and the spread for ten minutes:
SELECT to_timestamp(block_time_ms/1000.0) AS timestamp, CAST(bids[1].px AS DOUBLE) AS best_bid, CAST(asks[1].px AS DOUBLE) AS best_ask, CAST(asks[1].px AS DOUBLE)-CAST(bids[1].px AS DOUBLE) AS spread
FROM read_parquet('s3://hydromancer-reservoir/by_dex/hyperliquid/orderbook/1m/perps/date=2026-10-08/ETH.parquet')
WHERE block_time_ms>=epoch_ms(TIMESTAMPTZ '2026-10-08 15:30:00+00')
  AND block_time_ms<epoch_ms(TIMESTAMPTZ '2026-10-08 15:40:00+00')
ORDER BY block_time_ms;
For HIP-3 markets, the DEX is part of the folder path, and the file name is just the coin, without the dex: prefix you'll see in other datasets. Follow the order-book naming rules instead of copying a market name straight from your fills.
How to query S3 and save only the result
Start with a request you can describe in one sentence
Before anything technical, write down what you want in one sentence: "I want ETH liquidation fills for these ten minutes." That already tells you the dataset, the market and the time. The columns come after.
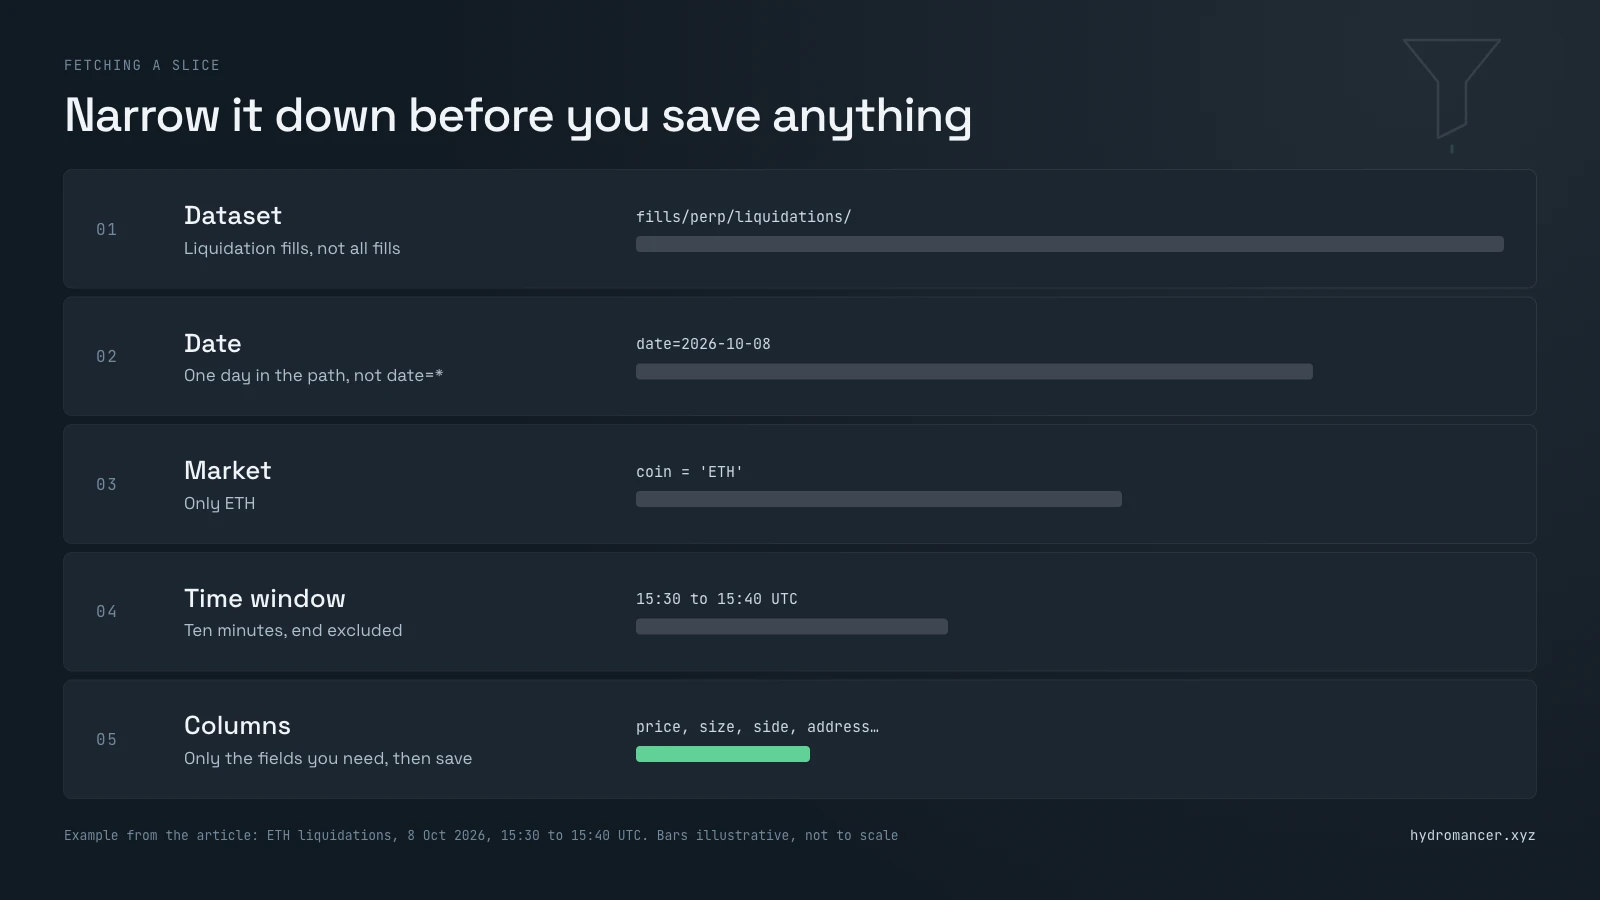
If a developer, analyst or AI coding assistant is helping you, you can hand them something like this:
Create a CSV of ETH liquidation fills from Reservoir for 8 October 2026, from 15:30 UTC up to but not including 15:40 UTC. Include the time, market, execution price, size, buy/sell side, wallet and liquidation status/method. Use the liquidation subset and select only those fields. Reuse my configured AWS session without displaying credentials. Save the result locally.
They'll still need AWS access set up. The brief describes what to pull; it doesn't give anyone access, and AWS fees still apply. The example further down does exactly what this brief asks for.
Query the file instead of downloading all of it
You don't have to download a whole day's file before you query it. DuckDB can read parts of a file straight from S3, fetch only the columns you ask for, and apply your filters as it reads.
That doesn't mean S3 sends you only the rows you end up with. DuckDB still reads the file's metadata and any chunks of data that might match. How much you save depends on your query and how the file is laid out, and a query that looks narrow can still read more than you'd expect.
Before you start
You need an AWS account, signed in through AWS CLI v2 (Amazon's command-line tool), with permission to read the Reservoir files. If you want to browse folders or use * in a path, you also need permission to list them. You don't need a Hydromancer API key.
The bucket is set to requester pays. Reservoir itself has no subscription fee, but AWS charges whoever pulls the data for requests and data transfer. Free data doesn't mean a free AWS bill.
The examples use DuckDB 1.4.5. On macOS or Linux, you can install it in its own environment like this:
python3 -m venv .venv
source .venv/bin/activate
python -m pip install duckdb==1.4.5
Then check that your AWS sign-in works:
aws sts get-caller-identityConnect without putting keys in the script
This setup borrows the credentials from your current AWS CLI session and keeps them in memory only. It also sets the bucket's region and turns on requester pays.
import json
import os
import subprocess
import duckdb

# Reuse the active AWS CLI session; do not paste credentials into this file.
credentials = json.loads(subprocess.check_output(
    ["aws", "configure", "export-credentials", "--format", "process"],
    text=True,
))
for source, target in [
    ("AccessKeyId", "AWS_ACCESS_KEY_ID"),
    ("SecretAccessKey", "AWS_SECRET_ACCESS_KEY"),
    ("SessionToken", "AWS_SESSION_TOKEN"),
]:
    if credentials.get(source):
        os.environ[target] = credentials[source]
    else:
        os.environ.pop(target, None)

con = duckdb.connect()
con.execute("INSTALL httpfs; LOAD httpfs;")
con.execute("SET TimeZone = 'UTC';")
con.execute("""
CREATE SECRET (
    TYPE s3,
    PROVIDER credential_chain,
    CHAIN 'env',
    REGION 'ap-northeast-1'
);
SET s3_requester_pays = true;
""")
Don't print the credentials variable or share what's in it. Sign in to AWS the way you normally do, and never paste access keys into a blog post, notebook or AI chat.
Extract ten minutes of ETH liquidations
Add this to the same Python file:
query = """
SELECT coin, timestamp, price, size, side,
       address, is_liquidation, liquidation_method
FROM read_parquet(
    's3://hydromancer-reservoir/by_dex/hyperliquid/fills/perp/liquidations/date=2026-10-08/fills.parquet'
)
WHERE coin = 'ETH'
  AND timestamp >= TIMESTAMPTZ '2026-10-08 15:30:00+00'
  AND timestamp <  TIMESTAMPTZ '2026-10-08 15:40:00+00'
ORDER BY timestamp
"""

# Accept either a standalone SQL recipe or one without its final semicolon.
query = query.strip().rstrip(";")

# Fetch once. Preview, counting and both exports now use the local result.
con.execute("CREATE TEMP TABLE extract AS " + query)
con.execute("COPY extract TO 'eth-liquidations-10min.parquet' (FORMAT PARQUET)")
con.execute("COPY extract TO 'eth-liquidations-10min.csv' (HEADER, DELIMITER ',')")
print("Extracted rows:", con.execute("SELECT count(*) FROM extract").fetchone()[0])
print(con.execute("SELECT * FROM extract LIMIT 5").fetchall())
Save both Python blocks together as extract.py, then run:
python extract.pyThe CSV and Parquet files appear in the folder you ran it from. The script pulls the data from S3 once and keeps it locally, so the second file, the row count and the preview don't go back to S3.
To pull a different dataset, swap the SQL inside query for one of the recipes above and rename the output files. You can paste the recipes as they are, because the script strips the final semicolon. Use the CSV for a spreadsheet. Parquet is usually the better choice if you'll keep analysing the data in code.
Check what's available before querying
To list one day's perp snapshot folder:
aws s3 ls \
  s3://hydromancer-reservoir/by_dex/hyperliquid/snapshots/perp/date=2026-10-08/ \
  --request-payer requester
To see a file's full size without downloading it:
aws s3api head-object \
  --bucket hydromancer-reservoir \
  --key by_dex/hyperliquid/fills/perp/liquidations/date=2026-10-08/fills.parquet \
  --request-payer requester \
  --query ContentLength --output text
That number is the size of the whole file in bytes, not how much a filtered query will transfer.
Best practices for fetching a particular slice
Where to start
For charts or a first test of a strategy idea, start with candles. For individual trades or liquidations, use fills. For positions and balances at a point in time, use snapshots. For spreads and depth, use order books.
Then narrow it down in this order where you can: dataset, venue, date, market or wallet, and columns. Reservoir organises its files by day, but what you keep can be much smaller than that.
See the Reservoir documentation [1] for the complete schemas, and the Hyperliquid historical-data overview for other ways to get the data.
Sources
[1] Hydromancer docs: Reservoir
[2] Reservoir schema: fills
[3] Reservoir schema: candles
[4] Reservoir schema: snapshots
[5] Reservoir schema: order book
[8] DuckDB: reading Parquet files
[9] DuckDB: S3 API support
[10] AWS: Requester Pays buckets
[11] AWS CLI: export-credentials
Read next
Hyperliquid historical S3 archive
Discover Reservoir by Hydromancer, our free tool for looking back at all of HyperCore’s onchain archive.
Read ↗
How to get Hyperliquid data
The official API only serves the last 10,000 fills. Discover how Reservoir gives you every Hyperliquid fill, candle, and book for free.
Read ↗
Hyperliquid vs Hydromancer API: When to Upgrade?
We built 18 apps and ran each against the live Hyperliquid and Hydromancer APIs, with real results showing when the free API is enough and when your app needs more.
Read ↗