Hyperliquid OHLCV Candles: API, History and CSV Export Guide
How to get Hyperliquid OHLCV candles: one free API request, how far back it goes, saving candles as CSV, and where to get older or 1-second candles.

Hyperliquid's candles are its OHLCV price data: one candle for each market and time slice, such as one BTC candle an hour.
Builders use them to draw and backfill charts and to run backtests.
Hyperliquid's API keeps only about the latest 5,000 candles for each market and interval.
For hourly or daily candles, that's months or years of price history, free and without a key. For 1-minute candles, it's about three and a half days, which is where backtests and chart backfills often run out.
If you'd rather see the proof first, you can skip straight to the Test and Validation section. It covers which requests were run and what they returned, which limits come from the docs, and which step was not run.
This guide covers how to:
- Pull candles with one free request.
- Work out how far back that request can go for each interval.
- Save candles as a CSV file.
- Get candle history beyond the free window.
Hyperliquid OHLCV data at a glance
OHLCV stands for open, high, low, close and volume: the first, highest, lowest and last price in a time slice, plus how much traded in it. Price charts are drawn from these candles.
Here's where to get them on Hyperliquid:
| You need | Where to get it | Key needed? |
|---|---|---|
| Recent candles, 1m to 1M | Hyperliquid's candleSnapshotrequest | No |
| Live candle updates | Hyperliquid's candlesubscription | No |
| 1-minute candles older than about 3.5 days | Hydromancer's candleSnapshot | Yes |
| 1-second, 15-second or 30-second candles | Hydromancer's candleSnapshotand candle stream | Yes |
| Months of candles for every market, in bulk | Reservoir, our archive on S3 | AWS account |
The examples are short, read-only Python.
What's in a Hyperliquid candle
Each candle is a small JSON object. The field names are short, so here's what each one means:
| Field | Meaning |
|---|---|
t / T | Open time and close time, in milliseconds (UTC) |
s / i | The market (coin) and the interval, such as BTC and 1h |
o / h / l / c | Open, high, low and close price |
v | Volume, counted in the coin itself (BTC, not USDC) |
n | Number of trades in the candle |
Prices and volume come back as strings. Convert them with float() or a decimal type before doing math.
Hyperliquid supports 14 intervals: 1m, 3m, 5m, 15m, 30m, 1h, 2h, 4h, 8h, 12h, 1d, 3d, 1w and 1M (one month). Source: Hyperliquid docs: Info endpoint.
About the snippets: like our docs, they're excerpts. They assume Python with requests installed, time, csv and os imported, and HYDROMANCER_API_KEY set in your environment for the Hydromancer example.
Get Hyperliquid candles from the API
candleSnapshot is a request to Hyperliquid's info endpoint, the same address that serves prices, order books and account data. Give it a coin, an interval and a time window in milliseconds.
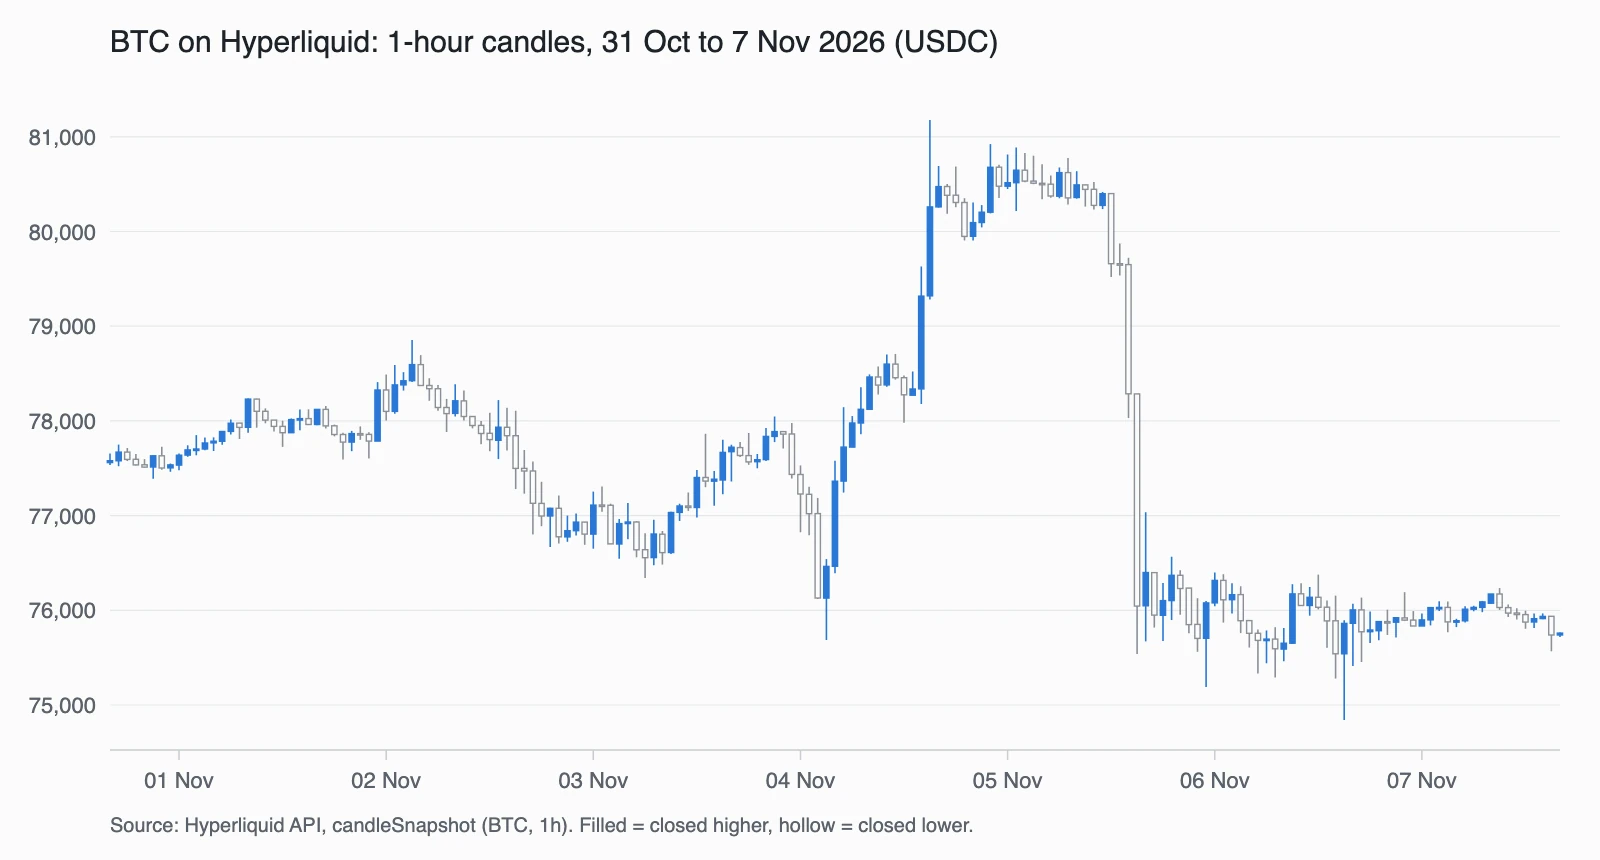
Here are the last 7 days of BTC 1-hour candles:
now = int(time.time() * 1000)
candles = requests.post("https://api.hyperliquid.xyz/info", json={
    "type": "candleSnapshot",
    "req": {"coin": "BTC", "interval": "1h", "startTime": now - 7 * 86_400_000, "endTime": now},
}).json()
print(len(candles), "candles. Latest:", candles[-1])169 candles. Latest: {'t': 1794067200000, 'T': 1794070799999, 's': 'BTC', 'i': '1h', 'o': '75740.0', 'c': '75760.0', 'h': '75767.0', 'l': '75717.0', 'v': '176.65001', 'n': 1093}Seven days is 168 hours, so why 169? The window starts and ends partway through an hour, so it touches 169 hourly candles.
The last one is the current hour and still open: its close time T is in the future, and its close price will keep changing until then.
Drawn as a chart, those candles look like this:
For HIP-3 markets, which other teams deploy, put the DEX name in front of the coin, such as xyz:XYZ100. Our Hyperliquid API guide covers the info endpoint in general.
How far back Hyperliquid's candle API goes
The docs put it plainly: only the most recent 5,000 candles are available.
Ask for a longer window and you get the latest 5,000 or so, not the start of your window. So how much history you get depends on the interval:
| Interval | About 5,000 candles covers |
|---|---|
1m | About 3.5 days |
5m | About 17 days |
15m | About 52 days |
1h | About 7 months |
4h | About 2.3 years |
1d | Over 13 years, more than Hyperliquid has existed |
That's room for a market's whole daily history, and more than two years of 4-hour candles for markets that have traded that long. Minute-level history is where it runs short, and there's no way to page further back: older 1-minute candles aren't served.
Mind the rate limit too. A candleSnapshot request costs 20 points of the 1,200 each IP address gets per minute, plus 1 point for every 60 candles returned.
A full 5,000-candle response costs about 103 points. See Hyperliquid rate limits for the full budget.
Export Hyperliquid candles to CSV
A CSV file opens in Excel, Google Sheets, pandas or any backtesting tool.
Python's built-in csv module is enough. Continuing from the request above:
with open("btc_1h.csv", "w", newline="") as f:
    w = csv.writer(f)
    w.writerow(["open_time_ms", "open", "high", "low", "close", "volume", "trades"])
    w.writerows([c["t"], c["o"], c["h"], c["l"], c["c"], c["v"], c["n"]] for c in candles)
The first rows of the file:
open_time_ms,open,high,low,close,volume,trades
1793462400000,77560.0,77657.0,77535.0,77580.0,190.32656,4851
1793466000000,77579.0,77750.0,77522.0,77671.0,385.15214,6334
If you're saving candles for a backtest, check the last row first. If its close time T is still in the future, it's the candle that was still open when you made the request, so drop it.
Live candle updates
To keep a chart moving, subscribe instead of polling. Open a live stream connection to wss://api.hyperliquid.xyz/ws and send {"method": "subscribe", "subscription": {"type": "candle", "coin": "BTC", "interval": "1m"}}.
Each update is the current candle, sent again as trades happen. Printed as open time, prices and trade count:
1794067620000 O 75754.0 H 75761.0 L 75754.0 C 75761.0 trades 42
1794067620000 O 75754.0 H 75761.0 L 75754.0 C 75761.0 trades 43
1794067620000 O 75754.0 H 75761.0 L 75754.0 C 75760.0 trades 44
The open time stays the same while the trade count climbs, so replace the candle with the same t rather than appending it. When t changes, the previous candle has closed.
For a full chart, combine the two: backfill with candleSnapshot, then keep it current with the subscription. Our trading terminal guide builds a chart this way.
How Hydromancer's API comes in when you need more Hyperliquid candle history
Hyperliquid's free API is enough for hourly and daily charts, and for live updates. Builders hit its limits when they need minute-level history, finer candles or every market at once:
| What you need | Without Hydromancer (Hyperliquid's API only) | With Hydromancer's API |
|---|---|---|
| 1-minute history | The latest 5,000 or so, about 3.5 days | Older 1-minute candles, up to 5,000 per request |
| Intervals | 1m to 1M | Adds 1s , 15s and 30s |
| Cost of one request | 20 points, plus 1 per 60 candles | 20 points, from your plan's per-minute budget (5,000 to 50,000) |
| Extra fields | None | Quote volume ( q ) and aclosed flag ( x ) |
| Live candles for every market | One candle subscription percoin and interval | allCandles : every coin atone interval (needs special permission) |
Hydromancer's candleSnapshot takes a coin, an interval, a startTime and an endTime, and an optional limit. Each candle has the fields described above, plus q and x.
Send the request to https://api.hydromancer.xyz/info with your API key. Source: Hydromancer docs: candleSnapshot.
Example: a full day of 1-minute candles from September
Without Hydromancer: asking Hyperliquid for 30 days of 1-minute candles returns only the latest few days. Continuing from the first request:
candles = requests.post("https://api.hyperliquid.xyz/info", json={
    "type": "candleSnapshot",
    "req": {"coin": "BTC", "interval": "1m", "startTime": now - 30 * 86_400_000, "endTime": now},
}).json()
days = (now - candles[0]["t"]) / 86_400_000
print(f"Asked for 30 days of 1-minute candles, got {len(candles):,}. The oldest is {days:.1f} days old.")Asked for 30 days of 1-minute candles, got 5,199. The oldest is 3.6 days old.With Hydromancer: a request for an older day returns that day. Here's the whole of 1 September 2026:
candles = requests.post("https://api.hydromancer.xyz/info",
    headers={"Authorization": f"Bearer {os.environ['HYDROMANCER_API_KEY']}"},
    json={"type": "candleSnapshot",
          "req": {"coin": "BTC", "interval": "1m", "startTime": 1788220800000, "endTime": 1788307200000}}).json()
print(len(candles), "candles. First:", candles[0])1440 candles. First: {'s': 'BTC', 'i': '1m', 't': 1788220800000, 'T': 1788220859999, 'o': '78575.00', 'h': '78575.00', 'l': '78555.00', 'c': '78556.00', 'v': '18.83685', 'q': '1479844.94757', 'n': 200, 'x': True}That's all 1,440 minutes of the day. For longer windows, call again from the last candle's t plus one interval.
The x: True tells you the candle is closed, so you don't have to compare its close time with the clock.
Which to use: for hourly, daily or live candles, Hyperliquid's free API is enough. Choose Hydromancer when you need minute-level history beyond a few days, sub-minute candles, or candles for every market at once.
Download months of candles in bulk
For a backtest over many markets or many months, request-by-request gets slow. Reservoir, our archive of Hyperliquid history, stores 1-second candles for every perp and spot market on Hyperliquid and every HIP-3 DEX.
Reservoir's candles are daily Parquet files on Amazon S3, starting 31 July 2025 and updated once a day. You can roll them up into any interval: 1 minute, 5 minutes, 1 hour.
The data itself is free. The bucket is set to requester pays, so AWS bills your account for what you download.
Every 1-second candle for every market since July 2025 is about 15.5 GB, which fits inside the 100 GB of free transfer every AWS account gets each month. Past that, it's roughly $1.80.
To turn a month of 1-second BTC candles into a 1-minute CSV or Parquet file, follow the worked example in our Reservoir guide.
What to know before you use Hyperliquid candles
A few details are easy to get wrong once candles go into a chart or a backtest.
#1: Times are milliseconds since 1970, in UTC
A candle's open and close times, t and T, and a request's startTime and endTime are milliseconds since 1970, in UTC. Divide by 1,000 for Python's datetime; JavaScript's Date takes milliseconds as they are.
#2: endTime is the end of your window, not a count
A candleSnapshot request takes a time window in milliseconds, from startTime to endTime, so endTime is a time, not a number of candles. To page through Hydromancer's history, start each request just after the last candle you received.
#3: Volume is in the coin, not in the quote asset
A candle's v counts volume in the coin itself, such as BTC, not USDC. Multiply by price for a rough USDC figure, or use Hydromancer's q field for the exact quote volume.
#4: Hydromancer's q can be null for older candles
Hydromancer's q field, the quote volume, may be null for candles before 1 August 2025, so handle that case when you parse it.
#5: Use the exact market name
HIP-3 markets need their DEX prefix, such as xyz:XYZ100. Spot markets use @ plus the pair's index from spotMeta, such as @107 for HYPE; PURR is the exception, as PURR/USDC.
Next steps
- Try it now: run the first snippet with any coin and interval. No key or account needed.
- Plan your requests: Hyperliquid rate limits shows what each request costs.
- Backtest on months of data: query Reservoir for 1-second candles in bulk.
- Need older 1-minute or sub-minute candles? See Hyperliquid historical data from Hydromancer.
Test and Validation
The runs logged for this guide are dated 8 November 2026, Singapore time (7 November in UTC, the time zone the candle times use). The prices, counts and candle times shown are a snapshot from those runs.
Every request in them was a read. The Hyperliquid requests needed no key.
What was runThe request for 7 days of BTC 1-hour candles returned 169 candles, and the CSV export wrote the file whose first rows are shown. The chart was drawn from the candles that request returned.
The request for 30 days of 1-minute BTC candles returned 5,199 candles, the oldest 3.6 days old. An earlier run of the same request returned 5,196.
Both counts were a little over the documented 5,000, which is why the guide says "about" the latest 5,000.
The live updates come from one connection to Hyperliquid's stream with the candle subscription shown. The three updates shown share one open time while the trade count rises.
The Hydromancer request for 1 September 2026 was sent once and returned 1,440 candles. An independent retest ran the Hyperliquid requests again; it checked the Hydromancer request by reading the code, without sending it.
What comes from the docsThe 5,000-candle limit, the 14 intervals, the HIP-3 prefix and the spot market names come from Hyperliquid's info endpoint docs. The request costs come from Hyperliquid's rate limit docs, and the figure of about 103 points matches our rate limits guide.
The coverage table is arithmetic: about 5,000 candles times the interval.
Hydromancer's extra intervals for requests, its q and x fields, its cost per request, its limit of 5,000 and the null quote volume before 1 August 2025 come from Hydromancer's candleSnapshot docs.
The same intervals on its candle stream come from Hydromancer's candle stream docs. allCandles and its permission come from Hydromancer's allCandles docs.
The Reservoir download was not run for this guide. The bulk section links to the worked example in our Reservoir guide instead of showing its own code.
The Reservoir size, the cost and the 31 July 2025 start come from that guide. What Reservoir stores comes from Hydromancer's Reservoir docs.
FAQ
Does Hyperliquid have an OHLCV API?
Yes.
The candleSnapshot request on Hyperliquid's info endpoint returns OHLCV candles for any market, at 14 intervals from 1 minute to 1 month. It needs no API key.
How many candles does Hyperliquid's API return?
Only about the most recent 5,000 for each market and interval. That's about 3.5 days of 1-minute candles but years of daily ones.
How do I download Hyperliquid candle data as a CSV?
Request the candles with candleSnapshot, then write each one as a row with Python's csv module, as shown above. For months of data across many markets, Reservoir's daily Parquet files save you thousands of requests, and any Parquet tool can export them as CSV.
Does Hyperliquid have 15-second or 30-second candles?
Not on its own API; its smallest interval is 1 minute. Hydromancer's API adds 1-second, 15-second and 30-second candles, both by request and as a live stream.
Can I get candles for HIP-3 markets?
Yes. Add the DEX name as a prefix to the coin name, such as xyz:XYZ100, and send the request as usual.
Sources
[1] Hyperliquid docs: Info endpoint
[2] Hydromancer docs: candleSnapshot
[3] Hydromancer docs: allCandles
[4] Hydromancer: Reservoir guide
Read next

Hyperliquid Stop-Loss: Guide for Traders & Builders
How stop-loss and take-profit orders work on Hyperliquid, why every waiting one is public, and how traders and builders can read where they sit.

How to Launch Point & Referral Programs on Your Hyperliquid App
Run referrals and points on Hyperliquid builder codes: discount referred users, pay referrers from real fills, score points fairly and spot farming.

Hyperliquid Slippage: What Market Orders Cost by Size
Measured slippage on Hyperliquid for $1,000 to $1 million market orders on BTC, ETH, HYPE and HIP-3 markets, plus how to estimate it for your own order.